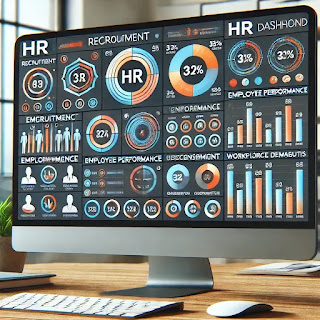
An HR Dashboard is a visual tool that gives an overview of key HR metrics and data — all in one place. It helps HR teams and managers monitor performance, track workforce trends, and make data-driven decisions.
🎯 What’s in an HR Dashboard?
It typically displays data in charts, graphs, and tables for quick analysis. Common sections include:
-
Recruitment Metrics
- Time to hire
- Cost per hire
- Number of open positions
- Candidate source effectiveness
-
Employee Performance Metrics
- Goal achievement rates
- Productivity levels
- Performance reviews
- Training completion rates
-
Workforce Demographics
- Employee count by department, location, gender, age, etc.
- Diversity and inclusion stats
-
Employee Engagement and Satisfaction
- eNPS (Employee Net Promoter Score)
- Survey results on morale and engagement
- Turnover and retention rates
-
Compensation and Benefits
- Average salary per role/department
- Benefits participation rates
- Overtime and payroll insights
-
Attendance and Leave Tracking
- Absenteeism rates
- Paid time off (PTO) balance
- Sick leave trends
-
Learning and Development Metrics
- Training hours per employee
- Skill gaps identified and filled
- Employee growth paths
-
Compliance and Risk Monitoring
- Incidents reported
- Policy violations
- Certification or training compliance rates
💡 Why Use an HR Dashboard?
- Real-time insights: See workforce changes as they happen.
- Data-driven decisions: Spot trends, identify issues, and predict outcomes (e.g., high turnover risk).
- Efficiency boost: Save time compiling data manually.
- Goal tracking: Monitor progress on HR initiatives like DEI, retention, and upskilling.


0 Comments